


Daily Rundown
- Chief Strategist, Bryan Jordan CFA

- 11m
- 2 min read
August 21, 2026
Chart of the Day
Number of the Day
27.9
The Philadelphia Fed’s manufacturing employment index in August, up from 10.0 in the prior month and the highest reading since April 2022
Quote of the Day
“So June was a little more obvious as we look at the quarter in terms of consumers making tradeoffs. And it’s why we have leaned so heavily into lower prices.”
Walmart CFO John David Rainey
Thursday’s Highlights
Initial unemployment claims (week of 8/9) fell by 6,000 to 206,000.
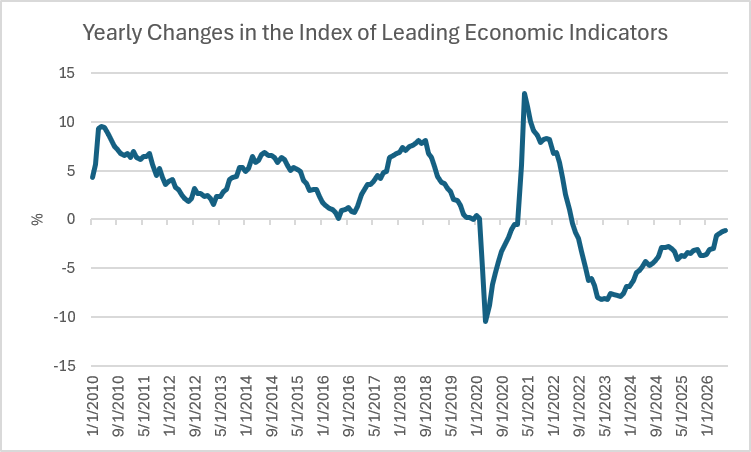
The index of leading economic indicators (July) rose by 0.2 percent, led by falling jobless claims.
The Philadelphia Fed manufacturing index (August) rose by 6.0 points to 47.4, highest since 2021.
Walmart same-store sales (May-July) moved higher by 2.6 percent year-over-year.
Quick Commentary
The rise in the leading indicators in July was the third in the last four months, a major shift after the series recorded only three increases in total from 2022 to 2025. The turnaround has been driven in part by the resurgent manufacturing sector, as core capital goods orders and the ISM new orders index, two of the ten LEI components, have both made sharp moves to the upside this year. Factory employment has also improved, and, as hinted by yesterday’s Philadelphia Fed report, is likely poised for further gains in the months ahead. This is still a narrowly-driven expansion, but the areas that are keeping it afloat are for now showing very little sign of letting up.
Daily Trivia
What made 381.17 a fabled number on Wall Street in the early-to-mid 20th century, one that was very much in the news in November 1954?
(Thursday’s Question: Due in part to the relatively large size of its average household, which state ranks last in the U.S. in the number of housing units per capita? Answer: Utah)